


Vol. XXXII Issue 1
Article 4
DOI: 10.35407/bag.2021.32.01.04
ARTÍCULOS ORIGINALES
Analysis of mixed data
to select bananas clones (Musa SPP.) To be included in a germplasm bank
Análisis de datos
mixtos para seleccionar clones de banana (Musa SPP.) A ser incluidos en un banco de germoplasma
Del Medico A. P. 1
Tenaglia G.2
Lavalle A. L.3
Vitelleschi M. S.4
Pratta G. R.1,5 *
1 Instituto de Investigaciones en Ciencias Agrarias de Rosario, Consejo
Nacional de Investigaciones Científicas y Técnicas.
2 Centro de Investigación y Desarrollo Tecnológico para la Pequeña
Agricultura Familiar, Instituto Nacional de Tecnología Agropecuaria.
3 Departamento de Estadística, Universidad Nacional del Comahue.
4 Consejo de Investigaciones de la Universidad Nacional de Rosario, Instituto
de Investigaciones Teóricas y Aplicadas de la Escuela de Estadística, Facultad
de Ciencias Económicas y Estadística, Universidad Nacional de Rosario.
5 Facultad de Ciencias Agrarias, Universidad Nacional de Rosario.
* Corresponding author: Guillermo R. Pratta gpratta@unr.edu.ar
ORCID 0000-0002-3682-0946
ABSTRACT
In an asexually reproducing hybrid such as banana (Musa spp.),
the assessment of clones in the short term is limited because replications are
frequently unavailable in the proper number. The aim of this work is to propose
the Multiple Factor Analysis of Mixed Data (MFAmix) as a tool for establishing
objective criteria to identify banana clones that preserve variability for
qualitative and quantitative variables. In the long term, the aim is the
development of a banana germplasm bank. MFAmix was applied on a population
composed of 124 banana clones collected from different farmers’ fields and four
controls. Two groups of variables related to the agronomic aptitude of the
clones were evaluated, one composed of nine quantitative variables, and the
other, composed of three dichotomous qualitative variables. A Selection Index
(SI) was built from the MFAmix coordinates in order to rank the clones and
select a subset that allows to preserve the existing genetic variability. The
first two axes of MFAmix explained a 49.47% of the total data variability. The
set of the banana clones was successfully characterized based on quantitative
and qualitative variables. In the long term, the creation of a banana germplasm
bank should consider the height and diameter of the plant, the rachis bunch
weight and the hands weight, and the qualitative variable plant leafiness.
Key words: Asexual hybrid, Collection of
germplasm, Multivariate analysis, Musaceae
RESUMEN
En un híbrido de reproducción asexual
como banana (Musa spp.), la evaluación de los clones en el corto plazo
es limitada debido a que generalmente no se cuenta con el número adecuado de
repeticiones. El objetivo de este trabajo es aplicar la técnica de Análisis
Factorial Múltiple de Datos Mixtos (AFMmix) como una herramienta para
establecer criterios objetivos de manera de identificar clones de banana que
preserven la variabilidad de los caracteres cualitativos y cuantitativos. A
largo plazo, el objetivo es desarrollar un banco de germoplasma de banana. Se
aplicó el AFMmix a una población de 124 clones de banana recolectados de
diferentes campos de productores y cuatro testigos comerciales. Se evaluaron
dos grupos de variables relacionadas con la aptitud agronómica de los clones,
uno compuesto por nueve caracteres cuantitativos, y el otro, por tres
caracteres cualitativos dicotómicos. Se construyó un Índice de Selección (IS) a
partir de las coordenadas del AFMmix de manera de ordenar a los clones de
banana para seleccionar un subconjunto de ellos que permita conservar la
variabilidad genética existente. Los dos primeros ejes del AFMmix explicaron un
49,47% de la variabilidad total de los datos. Se caracterizó satisfactoriamente
al conjunto de clones de banana a través de las variables cuantitativas y
cualitativas. A largo plazo, en la creación de un banco de germoplasma de
banana se debe considerar a la altura y diámetro de la planta, al peso del
raquis y peso de las manos, y al carácter cualitativo frondosidad de la planta.
Palabras clave: Híbrido asexual, Colección
de germoplasma, Análisis multivariado, Musaceae
Received: 12/19/2020
Revised version received: 05/03/2021
Accepted: 06/17/2021
INTRODUCTION
Banana (Musa spp.) is a crop of fundamental importance for the
economies of many developing countries. In terms of gross production value, it
is the fourth most important food crop in the world, after rice, wheat and
maize (Arias et al.,
2004). In northern Argentina, a subtropical area, the banana crop suffers
from suboptimal climate conditions, affecting diversity. Thus, there are
genotypes which are adapted to environments which are less favorable for
traditional production. Therefore, in Argentina there is a crop diversity which
is unique in the world (Ermini et al.,
2013, 2016). The banana is an asexual reproduction hybrid, the selection of
clones in the short term, is limited due to the lack of the appropriate number
of repetitions. A germplasm bank is a collection of live plant material which
aims to preserve the genetic variability existing in one or more species of
interest. Germplasm banks are the main means to protect the plant diversity of
the different crop species, and identify accessions for breeding programs,
basic researches, and production. Agronomy problems derived from the excessive
uniformity of the crops can be solved by introducing local varieties. Hence
both the conservation and use of the genetic variability available in germplasm
banks are presently revaluated (Defacio, 2009). Some authors
reported the use of Principal Components Analysis (PCA) (Defacio, 2009) and
Generalized Procrustes Analysis (GPA) (Bramardi, 2005) to identify varieties
to conserve in a germplasm bank. The disadvantages of using these methodologies
are as follows. Through PCA, it is not possible to analyze qualitative
variables as active variables; i.e. they can only be introduced as
supplementary variables, not intervening in calculating the coordinates of
individuals and variables. Through GPA, it is possible to work with the
synthetic variables resulting from applying PCA on the quantitative variables
and Principal Coordinate Analysis (PCoA) on the qualitative variables. On this
occasion, it is not possible to determine which variables are the ones which
contribute the most to the formation of the axes or factors, making it
difficult to characterize the cultivars through the evaluated variables. There
is a relatively new methodology, the Multiple Factor Analysis of Mixed Data
(MFAmix) (Pagès, 2002, 2014) that allows the
characterization of the cultivars according to the quantitative and qualitative
variables simultaneously and determines which variables mostly contribute to
the total variability. MFAmix provides equations that are linear combinations
of the original variables and form axes of highest variation that allow to
differentiate cultivars. Therefore, the aim of this report was to propose the
MFAmix as a tool for establishing objective criteria to identify banana clones
that preserve variability for qualitative and quantitative variables. In the
long term, the objective is to form a banana germplasm bank representing most
of the plant diversity available in the northeastern region of Argentina.
MATERIALS AND METHODS
Plant material
The study population was composed of 124 banana clones collected from
different producers’ fields in the province of Formosa, Argentina (Ermini et al., 2018) and four commercial
varieties extensively used in the world production that were the experimental
controls: Williams (Control 1), Jaffa (Control 2), Gal Azul (Control 3) and
Gran Enanao (Control 4) (Figure 1).
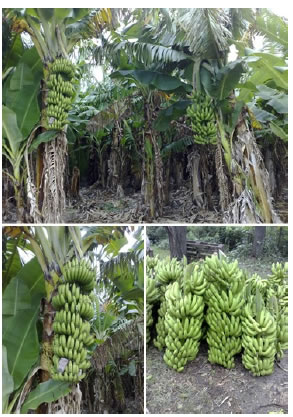
Figure 1. Trees and bunches of
banana fruit that correspond to clones collected from different farmers’
fields.
An augmented block design (Cotes and Ñústez, 2001) was carried out with
15 blocks of 14 plants each, where only the controls have repetitions. It was
accomplished at the experimental field of INTA Formosa which is located in
northern Argentina (26°11’31.8”S, 58°12’22.4”W), during the 2016-2017 crop
season. Two groups of phenotypic variables related to the agronomic aptitude of
the clones were evaluated, one composed of nine continuous quantitative
variables, and the other, composed of three dichotomous qualitative variables.
The quantitative variables were plant height (m), plant diameter (cm), rachis
bunch weight (kg), hands weight (kg), second hand diameter (cm), last hand
diameter (cm), second hand length (cm), last hand length (cm) and peel
thickness (mm). In a previous communication (Del Medico et
al., 2018a), the existence of genetic variability for these
quantitative variables was verified by a method originally developed to take
into account the lack of genotypic replications for clones due to the
experimental design used. The qualitative variables were plant leafiness (low
or high), bunch size (small or big) and prolificity of tier bunch (low or
high).
Statistical methodology
The MFAmix (Pagès, 2002, 2014) was applied.
This methodology allows the analysis of data tables in which the same group of
individuals is described through a group of variables, evaluated in different
conditions, moments or places. Variables can be quantitative or qualitative,
with the only restriction that the nature of these variables must be the same
within each group. MFAmix provides a similar weighting to both kinds of
variables. In general terms, the MFAmix algorithm consists of two stages. The preliminary
stage (separate analysis), in which each group of variables is analyzed
separately, in the case of quantitative variables set, through a PCA and for
qualitative variables set, through a Multiple Correspondence Analysis (MCA). The
first eigenvalue from each of these analyses will be used in the subsequent
step. The main stage (global analysis) consists in performing a PCA on
the whole data resulting from the juxtaposition of the configurations obtained
in the separate analysis, which are weighted by the inverse of the
corresponding first eigenvalue. This weighting maintains the structure of each
matrix and manages to balance the influence of the different groups of
variables. The objective of the MFAmix technique is to highlight the main
variability of individuals, the latter being balanced by the various groups of
variables. A global measurement of the relation between the configurations of
both groups of variables defined for the same individuals could be calculated
through the RV coefficient (Abdi, 2007). The RV coefficient
takes values between zero (the configurations are orthogonal) and one (the
configurations are homothetic). A Selection Index (SI) was built from the
coordinates of the quantitative variables obtained through MFAmix. SI is a
linear combination of the standardized quantitative variables whose weights are
their coordinates obtained through MFAmix, multiplied by the inertia explained
in that factor. The quantitative variables involved in its construction were
those whose contribution to each factor exceeded 2/3 of the corresponding
maximum coefficient in absolute value. The construction of this SI was based on
Del Medico et al. (2018b). The FactoMineR
package of R statistical software was used to accomplish this analysis.
RESULTS
Multiple Factor
Analysis of Mixed Data
The first PCA factor was moderately correlated with the first MCA factor
(-0.61.) The rest of the correlations between the factors of the separate
analyzes were low (Table 1). These correlation coefficients indicated that the
intensity of the relationship between the two analyses was slight, being only
linked on the first factor. Two factors were retained from the MFAmix, which
explain 49.47% of the total data inertia (Table 2). No rotation method was
used. The first two factors of the MFAmix were quite close to the factors of
the same rank in the separate analyses, except the second factor of the
quantitative group. Therefore, the use of MFAmix properly balanced the
contribution of these two types of variables (Figure 2). The quantitative
attributes which most contributed to the formation of the first factor were
hands weight, rachis bunch weight, and diameter, width and height of the plant.
In the second factor, no considerable contributions from the quantitative
values were observed (Table 3). The qualitative variables mostly contributing
to the first factor were bunch size and prolificity of tier bunch. On the
second factor, the largest contribution was made by the qualitative variable
plant leafiness, followed by bunch size (Table 3).
Table 1. Correlations between
factors obtained in the preliminary stage (separate analysis) of Multiple
Factorial Analysis of Mixed Data. The study population was composed of 124
banana clones and four controls. Two groups of variables related to the
agronomic aptitude of the clones were evaluated, one composed of nine
quantitative variables, and the other, composed of three dichotomous
qualitative variables. Each group of variables was analyzed separately through
a Principal Components Analysis (PCA) or Multiple Correspondence Analysis (MCA)
as appropriate.

Table 2. Decomposition of total
inertia by factor obtained through Multiple Factor Analysis of Mixed Data. The
study population was composed of 124 banana clones and four controls. Two
groups of variables related to the agronomic aptitude of the clones were
evaluated, one composed of nine quantitative variables, and the other, composed
of three dichotomous qualitative variables.
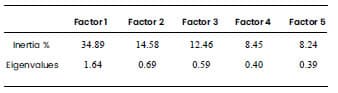
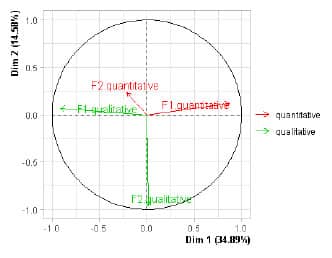
Figure 2. Factors of the separate
analyzes on the first two axes of Multiple Factorial Analysis of Mixed Data
(MFAmix). The study population was composed of 124 banana clones and four
controls. Two groups of variables related to the agronomic aptitude of the
clones were evaluated, one composed of nine quantitative variables, and the
other composed of three dichotomous qualitative variables. Dim 1 and Dim 2
correspond to the Factor 1 and 2, respectively, obtained in the MFAmix.
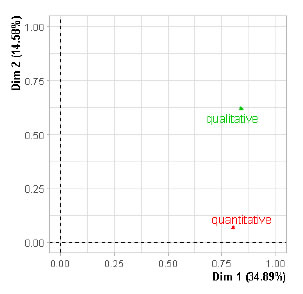
Figure 3. Representation of the
groups on the first two factors of Multiple Factorial Analysis of Mixed Data
(MFAmix). The study population was composed of 124 banana clones and four
controls. Two groups of variables related to the agronomic aptitude of the
clones were evaluated, one composed of nine quantitative variables, and the
other composed of three dichotomous qualitative variables. Dim 1 and Dim 2
correspond to the Factor 1 and 2, respectively, obtained in the MFAmix.
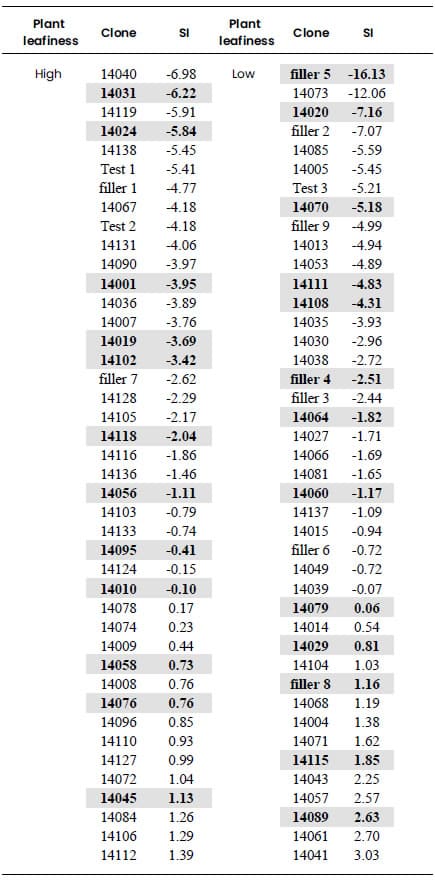
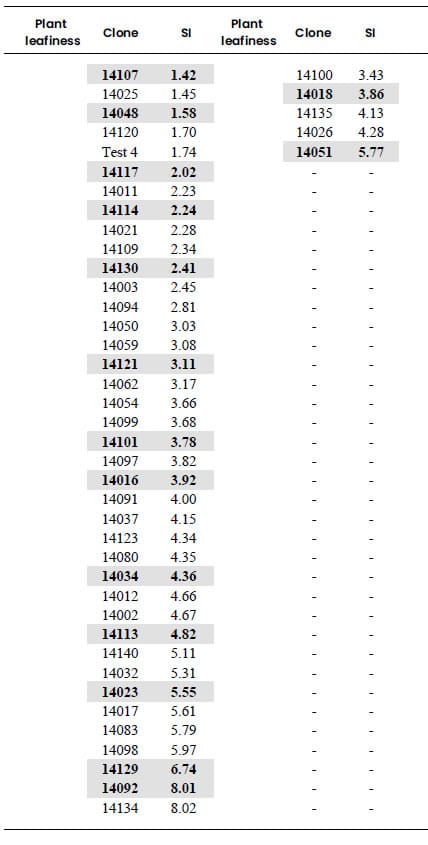
Table 4. Selection Index (SI) of
banana clones classified according to plant leafiness (high or low). SI was
built from the coordinates of the quantitative variables obtained through
Multiple Factorial Analysis of Mixed Data (MFAmix). SI is a linear combination
of the standardized quantitative variables whose weights are their coordinates
obtained through MFAmix, multiplied by the inertia explained in that factor.
In the representation of both groups of variables on the first factor
plane, there were no observable differences on the first derived factor.
However, both groups showed differences on the second factor (Figure 3).
The RV calculated between both groups of variables was equal to 0.30,
indicating that the relationship between the configurations corresponding to
both groups of variables under study was low, i.e., its information regarding
total variability was complimentary. Considering that the RV obtained was low,
that the discrepancies between the groups of variables appeared on the second
factor, and that the evaluated variable which mostly contributes to the
construction of such a factor was the qualitative variable plant leafiness, the
banana clones were classified according to the aforementioned variable. Hence,
two groups of clones were formed, one composed of Control 3, and four clones
corresponding to plants with low plant leafiness, and the other one composed of
Control 1, Control 2 and Control 4, and 78 clones corresponding to plants with
high plant leafiness. For this reason, individuals were represented in the
first principal plane of MFAmix, according to the qualitative variable plant leafiness.
The first factor orders the individuals according to the quantitative
variables. The second factor separates the individuals according to the
qualitative variable plant leafiness. The clones corresponding to plants with
high plant leafiness were found in the superior part (in red) and plants with
low plant leafiness in the inferior part (in green) (Figure 4).
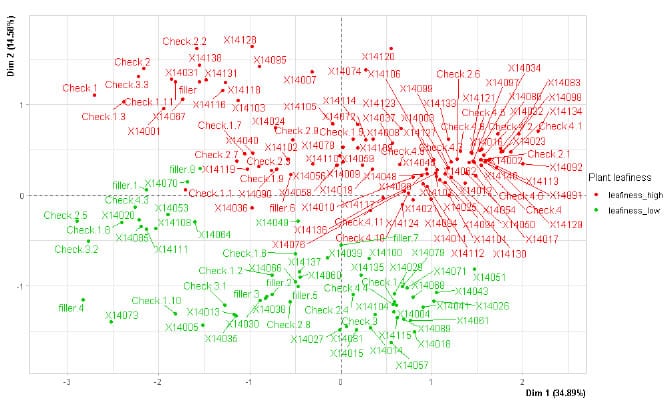
Figure 4. Representation of
banana clones on the first two factors of Multiple Factorial Analysis of Mixed
Data (MFAmix), according to the qualitative variable plant leafiness. The study
population was composed of 124 banana clones and four controls. Two groups of
variables related to the agronomic aptitude of the clones were evaluated, one
composed of nine quantitative variables, and the other composed of three
dichotomous qualitative variables. Dim 1 and Dim 2 correspond to the Factor 1
and 2, respectively, obtained in the MFAmix
Selection Index
Only the first factor was included in the construction of the SI, given
that the quantitative variables did not present considerable contributions to
the second MFAmix factor (Table 4) Based on data presented in Table 2 and Table
3, the SI constructed is:
SI = 1.64 (0.62 plant
height + 0.77 plant diameter + + 0.82 rachis bunch weigh+
0.83 hands weight)
The banana clones were arranged according to this SI in each of the two
groups previously determined according to the plant leafiness (high or low) (Table
4). Highlighted numbers in Table 4 identify the clones selected for the
construction of the germplasm bank. 40 clones were selected to create the
germplasm bank, which represent approximately 30% of the total banana clones
studied in this research. The selected number of clones in each group was
proportional to their size. It is recommended, in order to preserve the
existing genetic variability, to select clones with high, moderate and low SI
inside each group.
DISCUSSION
Adequate classification and conservation of the variability present in
the crops and their relatives are essential for the conformation of germplasm
banks, which results critical for future breeding programs (Fundora Mayor et al., 2004). The abundance of
material to evaluate, the handling limitations and the fact that, in general,
many variables are studied jointly, make the conformation of a germplasm bank
more difficult.
The use of quantitative and qualitative variables allows the characterization
of crops in a different and complementary manner. For this reason, it is
important to use an analysis technique which gets a consensus between both
types of variables (Defacio, 2009). For example, Bramardi et al. (2005) evaluated cucumber
cultivars for agronomic variables of qualitative and quantitative classes,
using the GPA technique for the joint analysis, and Defacio (2016) evaluated
local maize populations by GPA technique with the aim of simultaneously
analyzing the quantitative and qualitative variables.
This methodology is used in order to deal jointly with both kinds of variables.
In those cases, more numerous groups of cultivars were obtained using each kind
of variable separately. However, through GPA, it is not possible to determine
which variables are the most contributing to the formation of the axes or
factors, which makes it difficult to characterize the cultivars through the
evaluated variables. The benefit of MFAmix over other existent methodologies is
that it assigns equal importance to both groups of variables. Additionally, it
allows the characterization of the individuals according to the quantitative
and qualitative variables, and thus to form a subset which presents the greater
diversity. The MFAmix is a technique that allows deciding a selection criterion
that involves variables of different nature. Therefore, this methodology is an
appropriate tool for establishing objective criteria through the construction
of a SI for identifying banana clones that represent the plant diversity
available in the Argentinian Northeast.
CONCLUSION
In the present study, through the MFAmix technique, associations between
both groups of variables were detected, and the characterization of banana
clones according to quantitative and qualitative variables was successful. In
the long term, the creation of a banana germplasm bank should consider the
quantitative variables plant height and plant diameter, rachis bunch weight and
hands weight, as well as the qualitative variable plant leafiness.
REFERENCES
Abdi H. (2007) RV coefficient and congruence coefficient. In: Salkind N.J.
(Eds.) Encyclopedia of measurement and statistics. SAGE Publications Inc., Thousand Oaks, California, pp. 849-853.
Arias P., Dankers C., Liu P., Pilkauskas P. (2004) La economía mundial del banano 1985-2002.
Food &
Agriculture Organization.
Bramardi S.J., Bernet G.P., Asíns M.J., Carbonell E.A. (2005) Simultaneous
agronomic and molecular characterization of genotypes via the generalised
procrustes analysis: an application to cucumber. Crop Science. 45: 1603-1609.
Cotes J.M., Ñústez C.E. (2001) Propuesta
para el análisis de diseños aumentados en fitomejoramiento: Un caso en papa.
Revista Latinoamericana de la Papa. 12: 15-34.
Defacio R.A. (2009) Caracterización
y evaluación de la variabilidad genética en poblaciones nativas de maíz (Zea
mays L.) de la provincia de Buenos Aires en base a descriptores
morfológicos y agronómicos. Master thesis, Universidad Nacional de Rosario, Argentina.
Defacio R.A. (2016) Evaluación
comparativa de distintas estrategias de análisis de datos para la
caracterización y ordenamiento de la variabilidad genética de poblaciones
locales de maíz (Zea mays L.). Doctoral thesis, Universidad Nacional de
Rosario, Argentina.
Del Medico A.P., Ermini J.L., Tenaglia G.C., Vitelleschi M.S., Lavalle A.L.,
Pratta G.R. (2018a) Propuesta de un enfoque
estadístico para seleccionar clones de banana a partir de un diseño aumentado
teniendo en cuenta la variabilidad genética. Journal of Basic and
Applied Genetics. 14: 51-57.
Del Medico A.P., Ermini J.L., Tenaglia G.C., Vitelleschi M.S., Lavalle A.L.,
Pratta G.R. (2018b) Índice de selección para
múltiples caracteres en una población de banana (Musa spp.). XXIII Reunión
Científica del Grupo Argentino de Biometría. II Encuentro Argentino - Chileno
de Biometría. Octubre 2018, Neuquén,
Argentina, pp. 53
Ermini J.L., Pantuso F.S., Tenaglia G.C., Pratta G.R. (2013) Marcadores de AFLP en el cultivo de
banana: selección de combinaciones de cebadores y caracterización de la
biodiversidad. Revista de la Facultad de Ciencias Exactas, Químicas y
Naturales, Universidad de Morón. 11: 83-110.
Ermini, J.L., Tenaglia, G.C., Pratta, G.R. (2016) Genetic diversity,
ancestry relationships and consensus among phenotype and genotype in banana (Musa
acuminata) clones from Formosa (Argentina) farmers. Plant Cell
Biotechnology and Molecular Biology. 17: 267-278.
Ermini, J.L., Tenaglia, G.C., Pratta, G.R. (2018) Molecular diversity in
selected banana clones (Musa AAA “Cavendish”): adapted to the subtropical
environment of Formosa Province (Argentina). American Journal of Plant Science.
9: 2504-2513.
Fundora Mayor Z., Hernandez M., López R., Fernández L., Sánchez A., López
J., Ravelo E.L. (2004) Analysis of the variability in collected peanut (Arachis
hypogaea L.) cultivars for the establishment of core collections. Plant
Genetic Resources Newsletter. 137: 9-13.
Pagès J. Analyse factorielle de données mixtes. (2002). Revue de
Statistique appliquée. 52: 93-111.
Pagès J. (2014). Multiple factor analysis by example using R. CRC Press,
Boca Raton.